The challenge
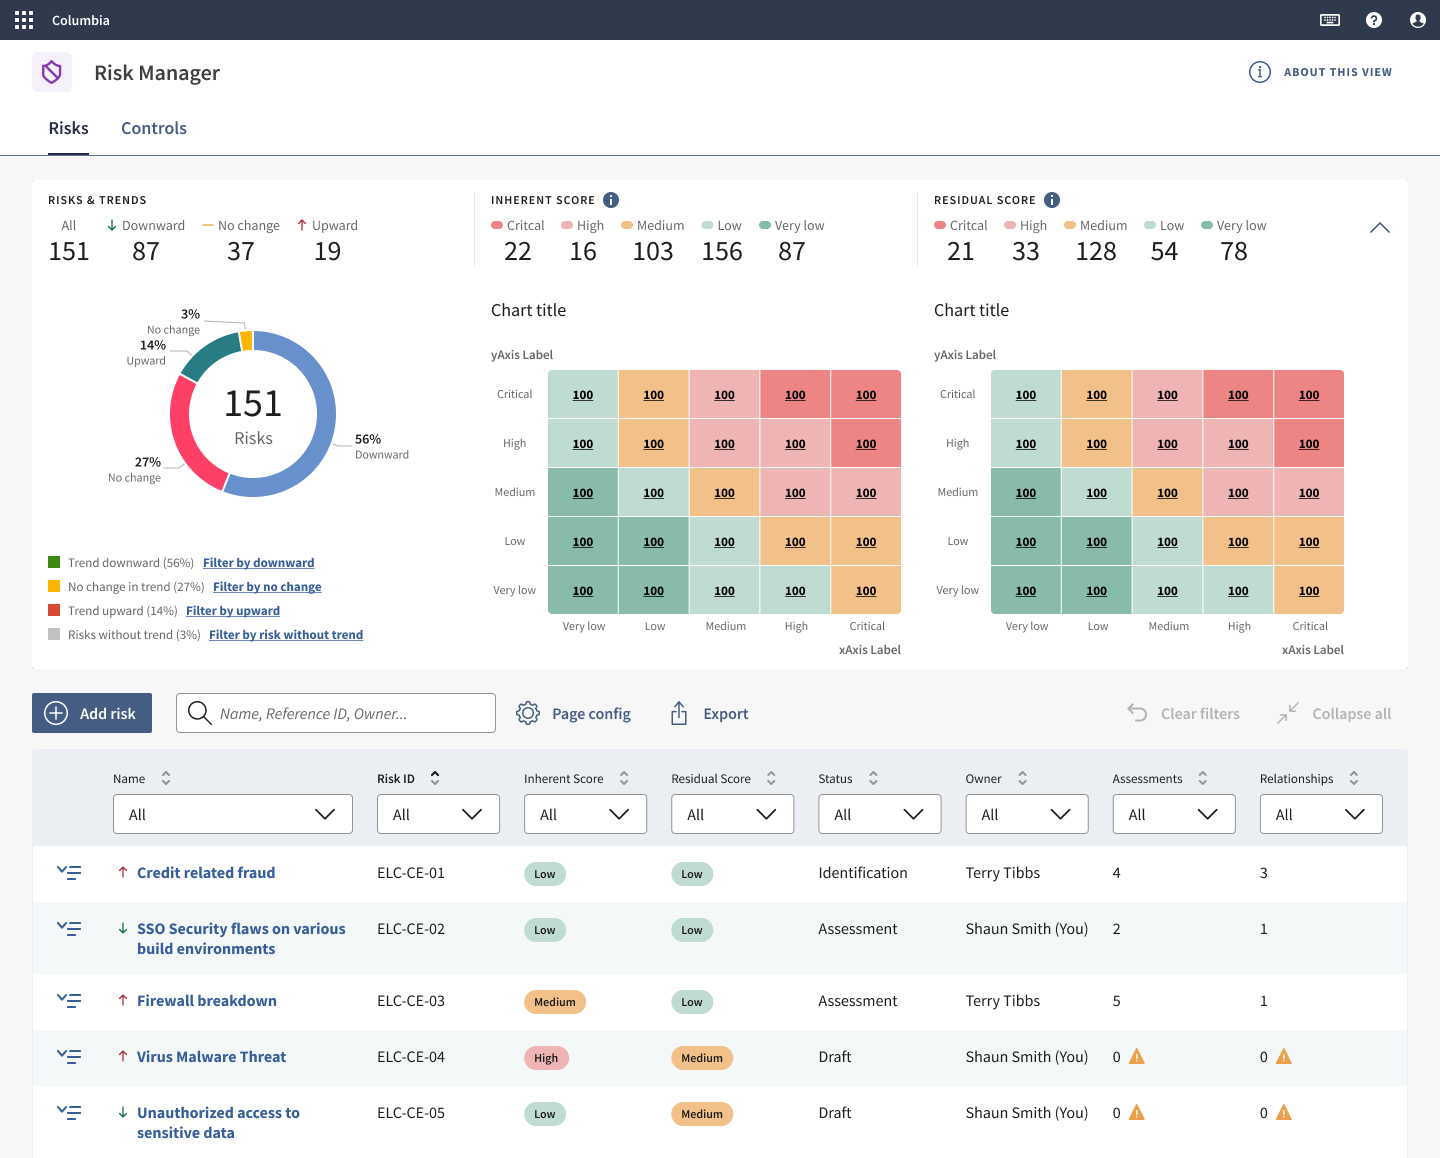
Heatmaps sit on the risk manager’s home page and give a quick overview of the company’s risk posture. Yet most clients had switched them off in the admin settings.
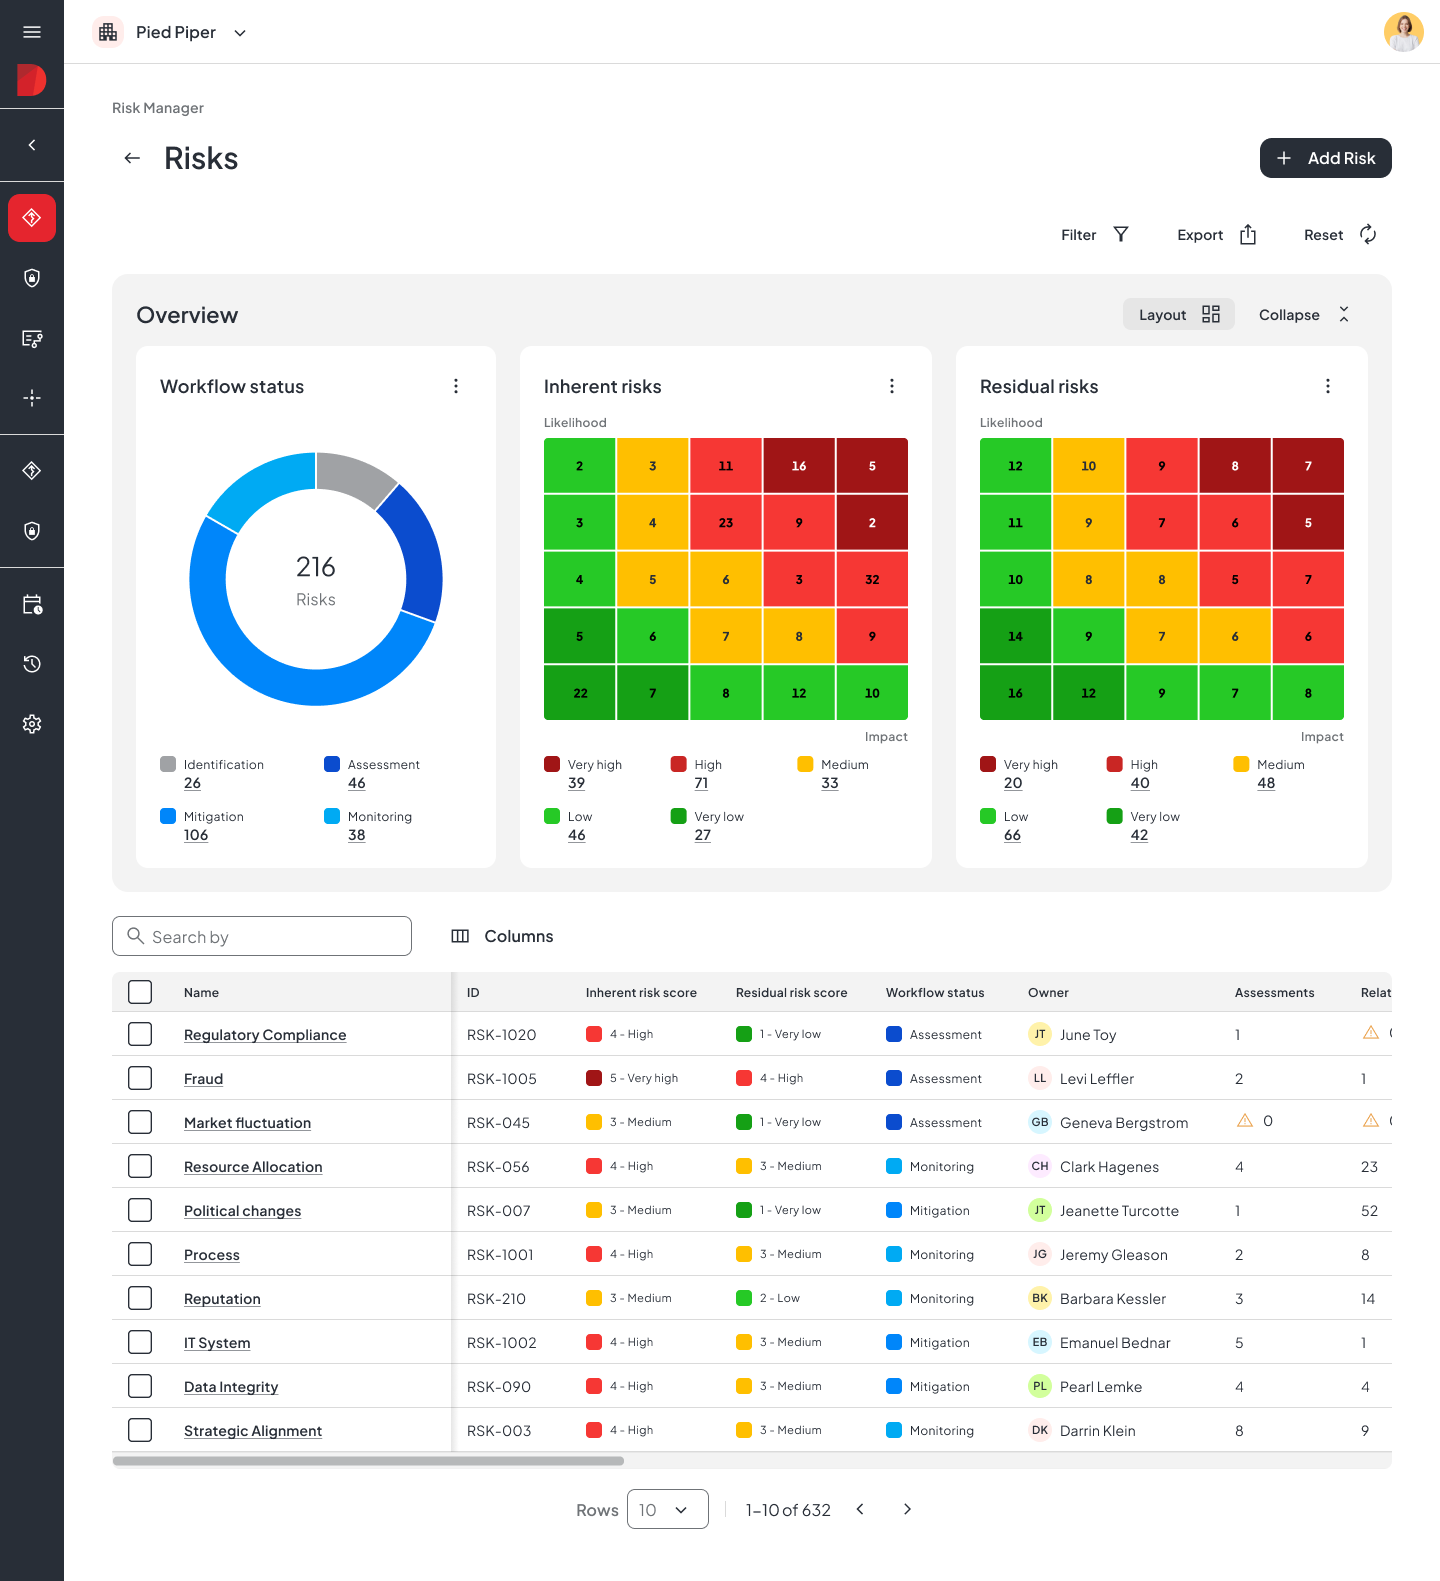
The heatmap had a long list of problems. Colours couldn’t be changed, inherent and residual risk were averaged into one view, and nothing could be adapted to how each organisation measures risk.
So why hadn’t it been fixed? Risk was one of twelve products in the portfolio, and the roadmap was pulled toward new AI features. A broken heatmap looked like maintenance. It wasn’t. It was the main way risk managers read their data.
Heatmap on

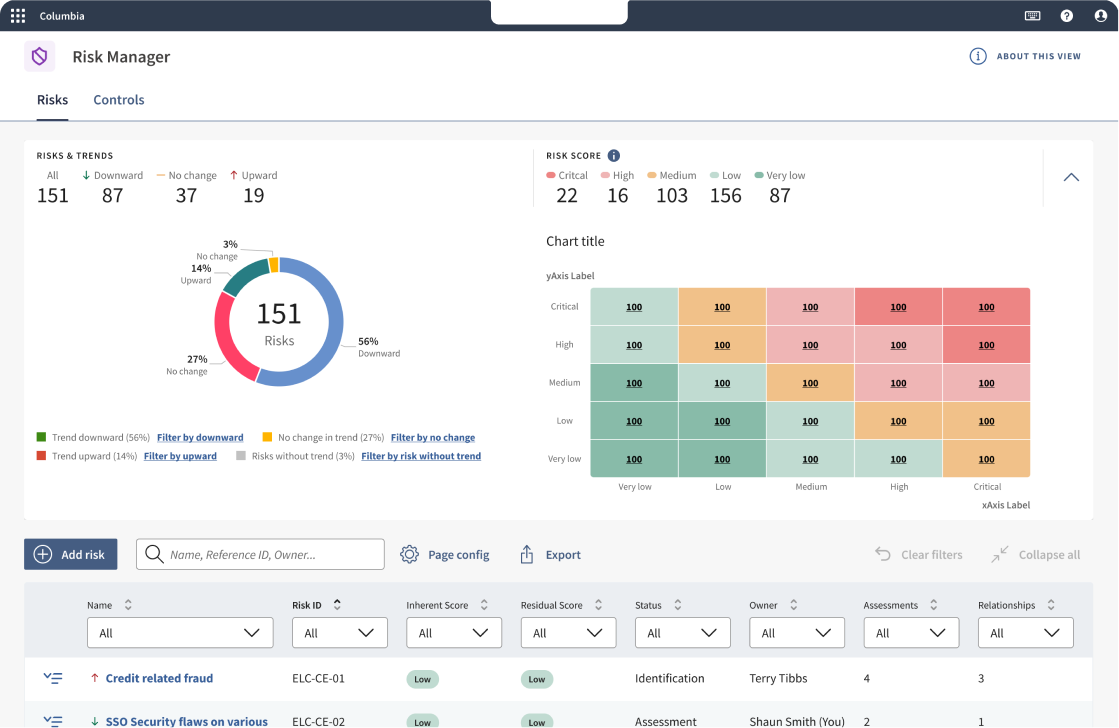
Heatmap off
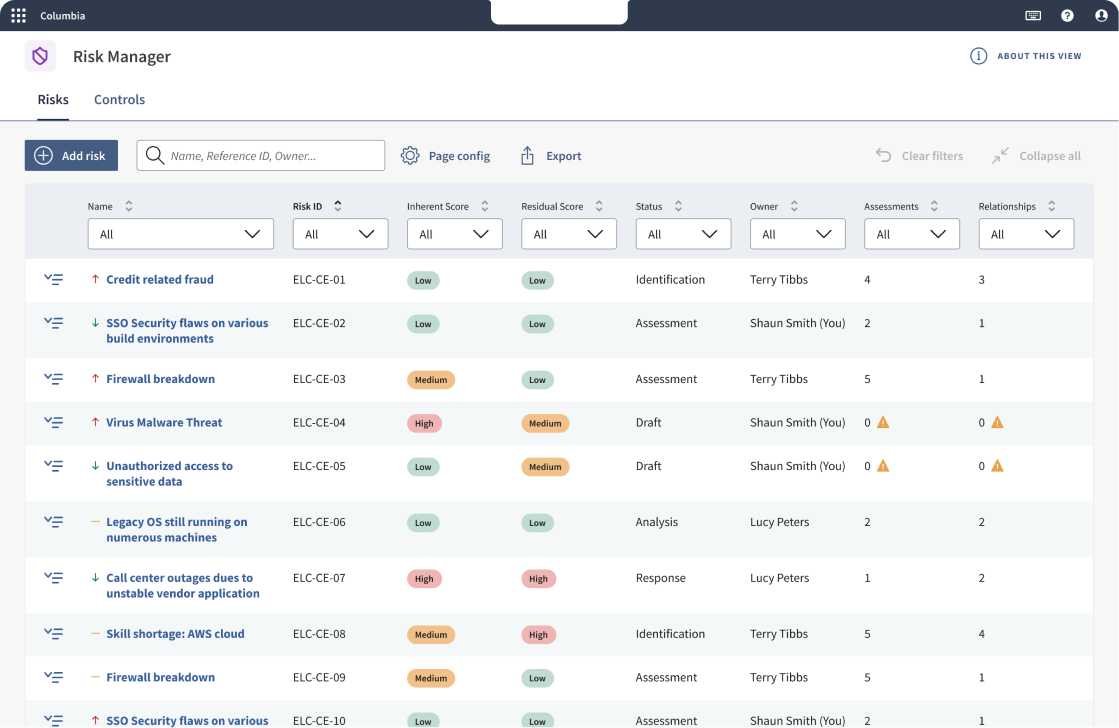
Risk Manager homepage with old heatmap
Making the case
Before designing anything, the PM and I had to get the project on the roadmap. We brought together what we had: how widely the heatmap was switched off, and the complaints that kept coming up in user tests and sales calls. We framed it as a trust problem, not a polish problem.
The discovery
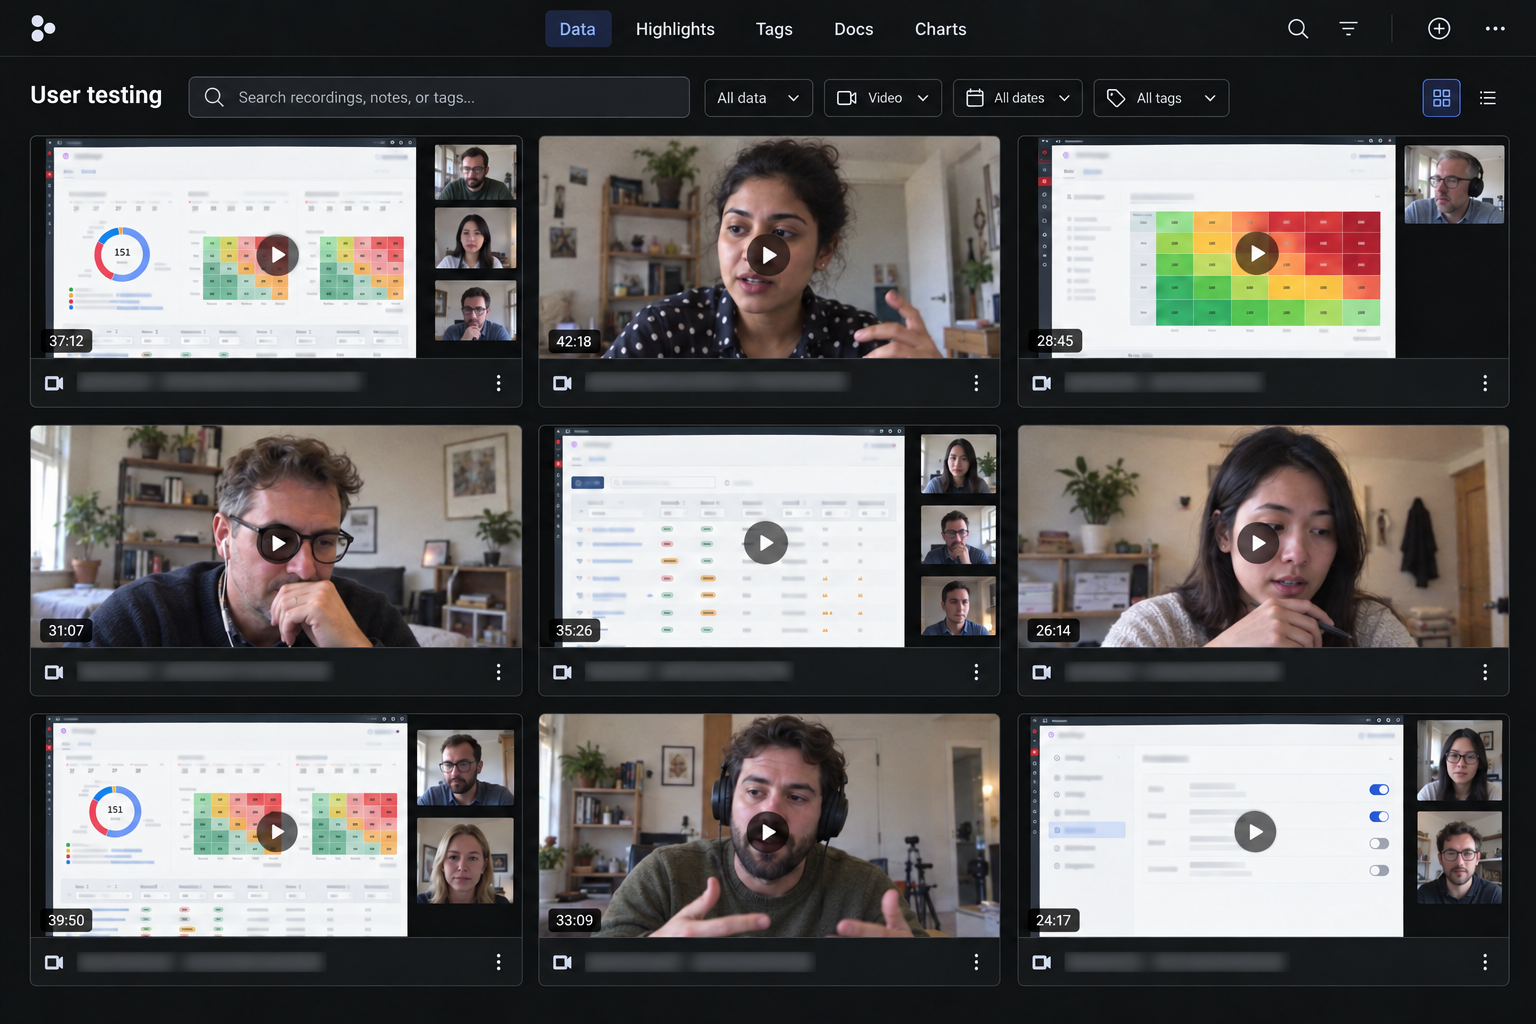
I wanted to understand the problem before designing anything, so we ran observational user tests, watched client demos and talked to subject-matter experts. One finding stood out: people didn’t trust the numbers. The data was wrong. Inherent and residual risk were averaged into one heatmap. In risk management that isn’t just unhelpful. It’s misleading.
Next, we needed to understand how this had happened. The cause was the legacy backend. The PM and I worked closely with engineering to understand its limits and find a workaround that still gave users a clear, usable experience.
The pivot
Our first idea was a set of hard-coded presets that clients could choose from.
I tested the first prototypes with users, and it turned out presets didn’t solve the problem. The more we tested, the more presets people asked for. Diligent’s clients are so different from each other that almost every one needed something else: naming conventions, scoring formulas, even the colours. In healthcare, for example, any likelihood above zero is red regardless of impact, because it could mean casualties. In other industries the same score might mean a small loss of income.
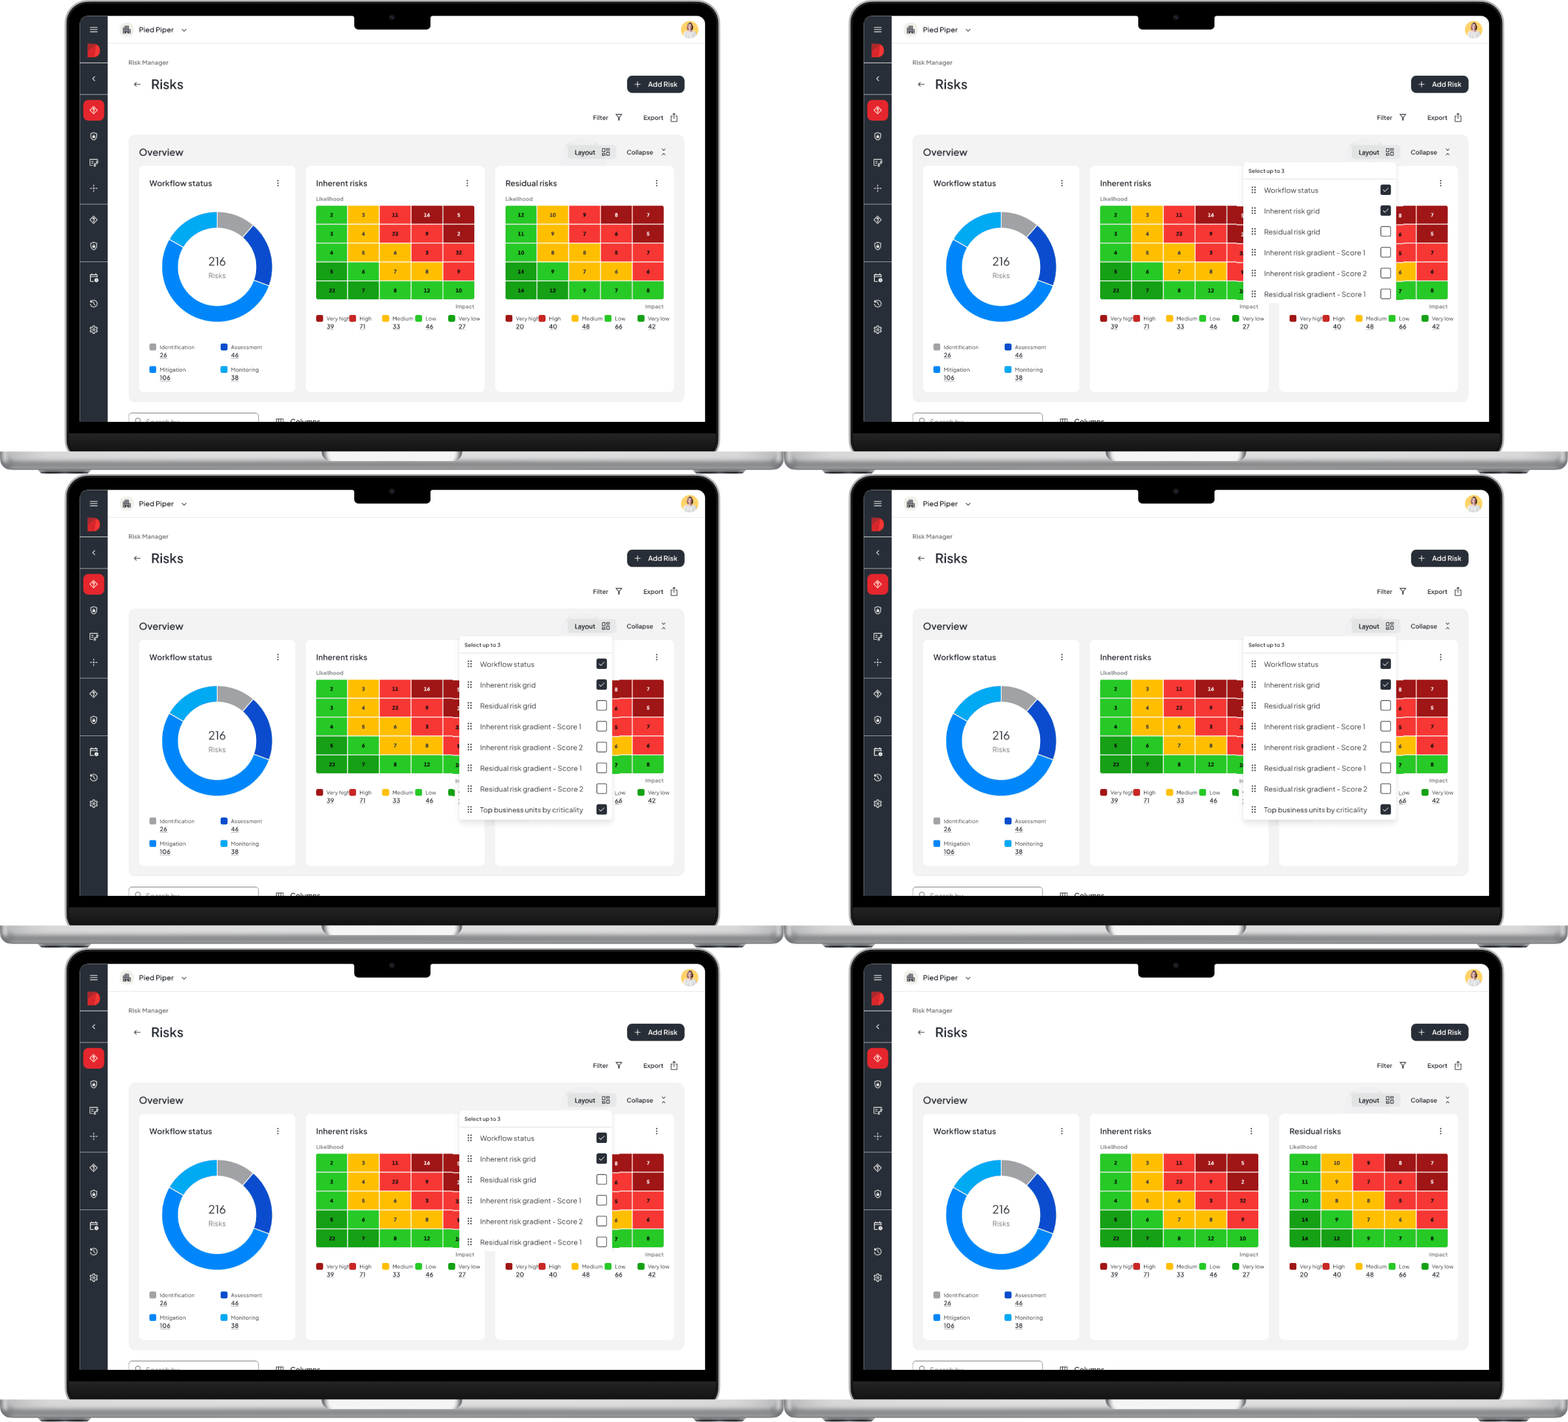
Heatmap layout menu
The solution
The PM, the tech lead and I explored many directions. The breakthrough came from users: in large enterprises, a senior risk professional sets up the framework and publishes it for the wider international team. We designed for exactly that mental model.
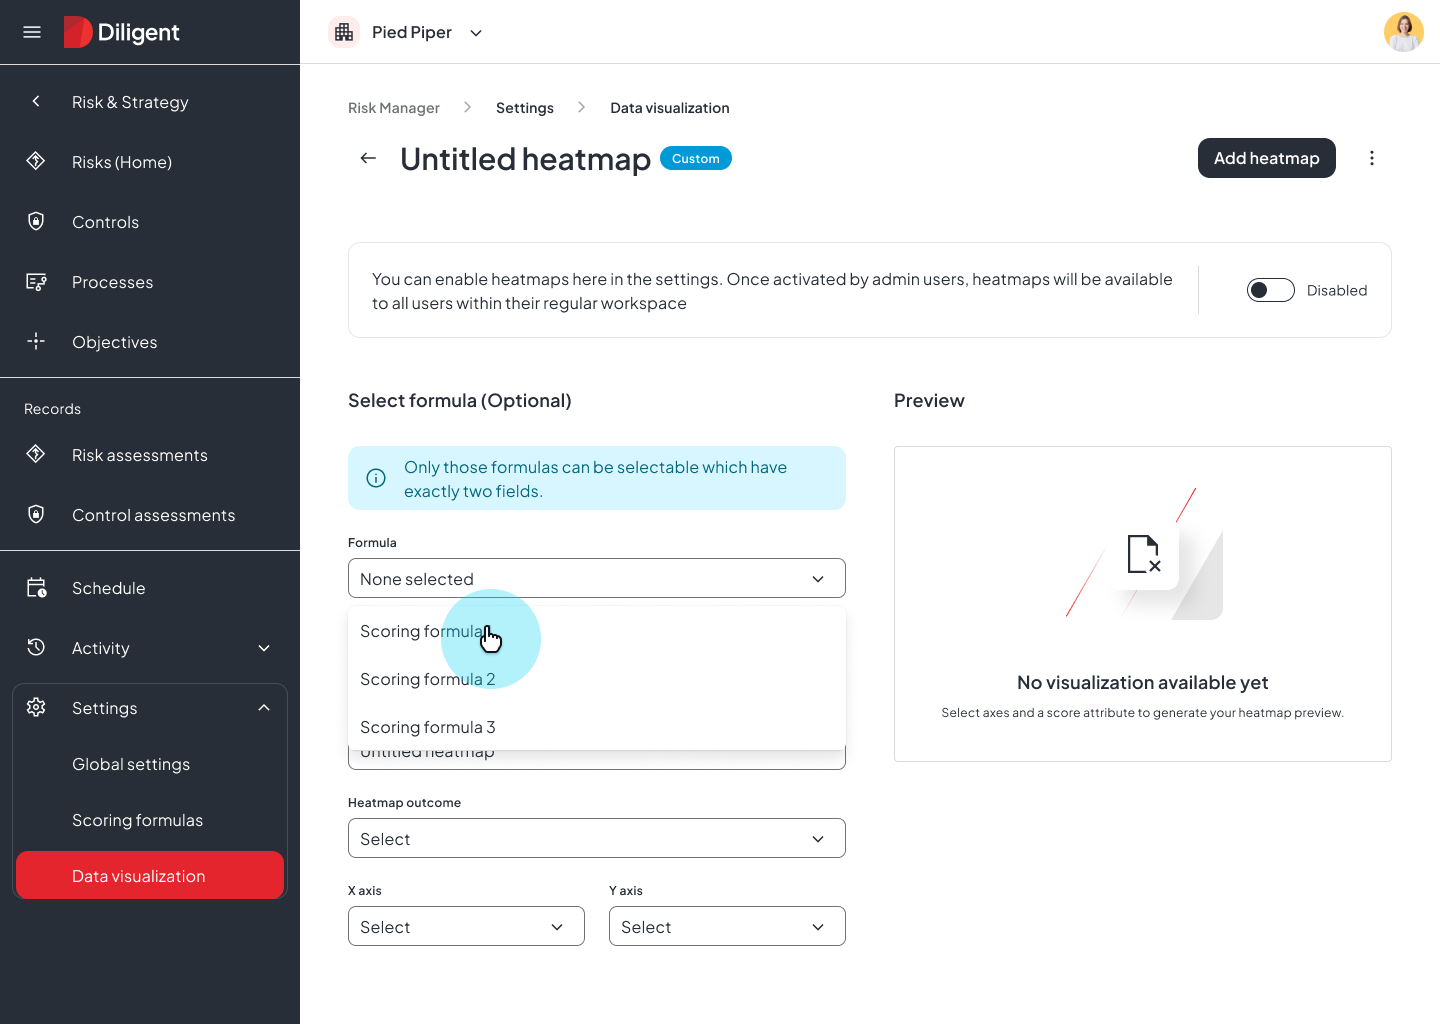
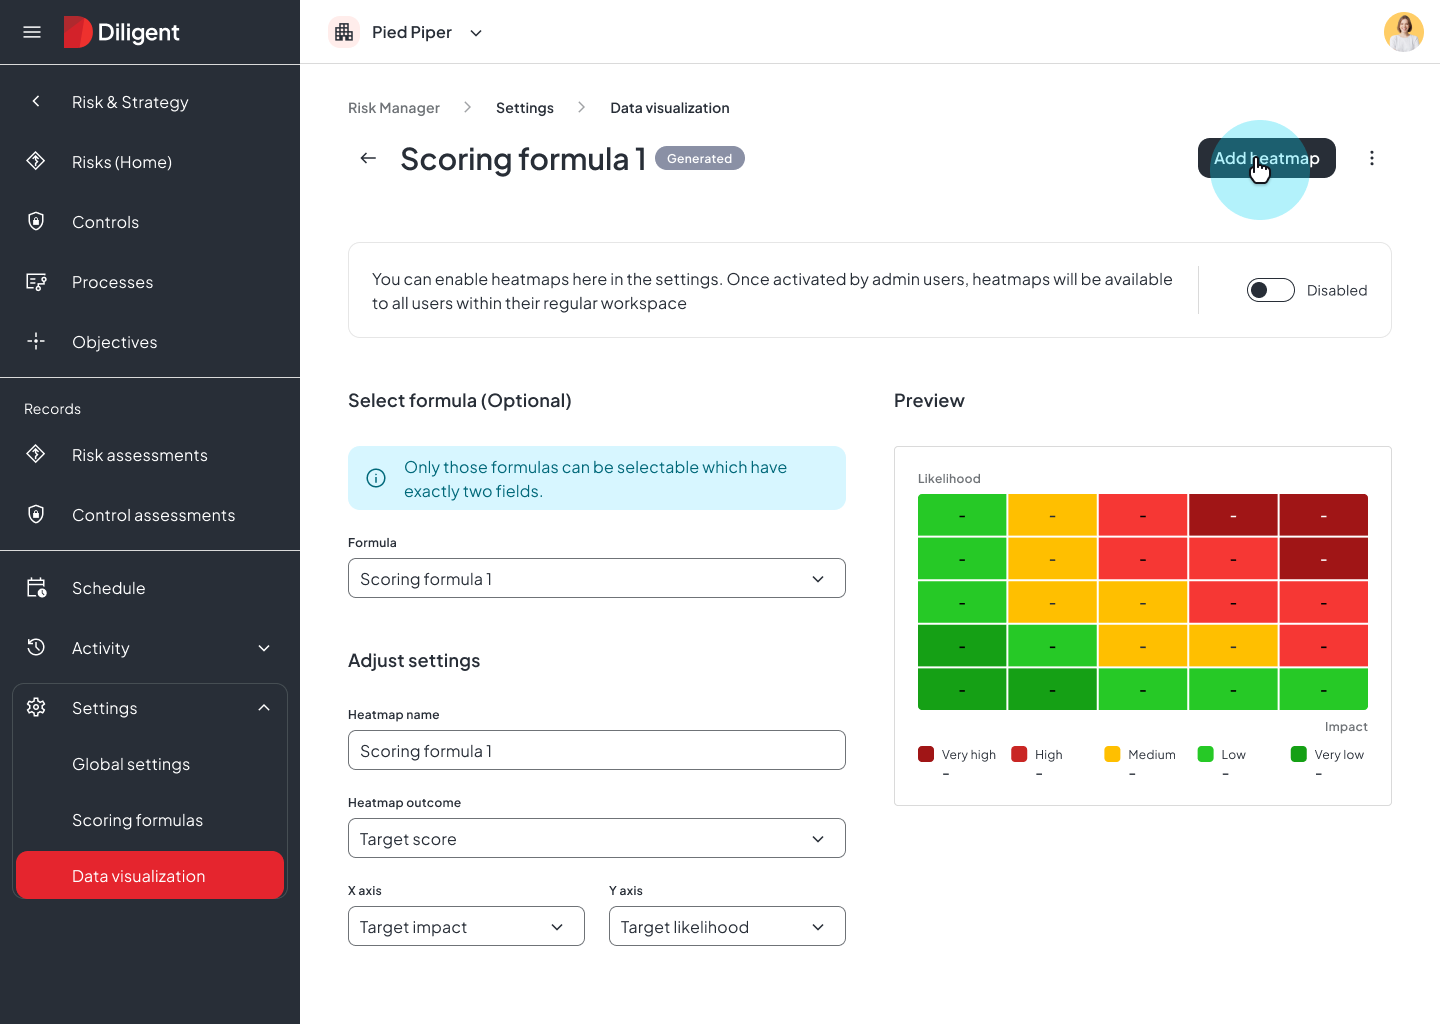
Instead of hard-coded heatmap logic, we built a configuration layer. In the settings, admins — the senior risk professionals — can create more than one heatmap, choose which data field goes on each axis, and set their own colour schemes.
We tested the idea early with real clients and subject-matter experts. The response was promising, so I moved on to high-fidelity designs and tested clickable prototypes I built with vibe coding.
Choosing the axis fields is the part that mattered most: it let legacy clients separate inherent and residual risk without any backend changes.
I designed it end to end and worked with engineering through launch.
The final design
Outcome
Admins used to switch this feature off. After launch it became one of the product’s best-received releases.
“Customers are raving about it.”
Product Manager, after launch
The same framework now runs customisable bar charts and is being extended to formula-based scoring. A heatmap fix became a reporting foundation.
It also changed what got prioritised. After this launch, other unglamorous, domain-specific user needs started getting space on the roadmap.